Overview
The Energy Transmission Project is an end-to-end cloud demo that mirrors the type of engineering stack used at industry-leading energy companies like Ameren. It’s built around a .NET 8 ASP.NET Core Razor Pages application, containerized with Docker, deployed with Kubernetes manifests, and automated with Jenkins, Ansible, and Git-based DevOps workflows. It also includes Prometheus and Grafana monitoring with an exported Grafana dashboard for EKS observability.
This project began with the goal of recreating the stack real energy companies use for grid reliability. I first deployed the Energy Transmission app on Red Hat OpenShift, set up the project and route, and verified the app running inside the cluster. But OpenShift is compute-heavy, and my local machine couldn’t support additional workloads or full observability.
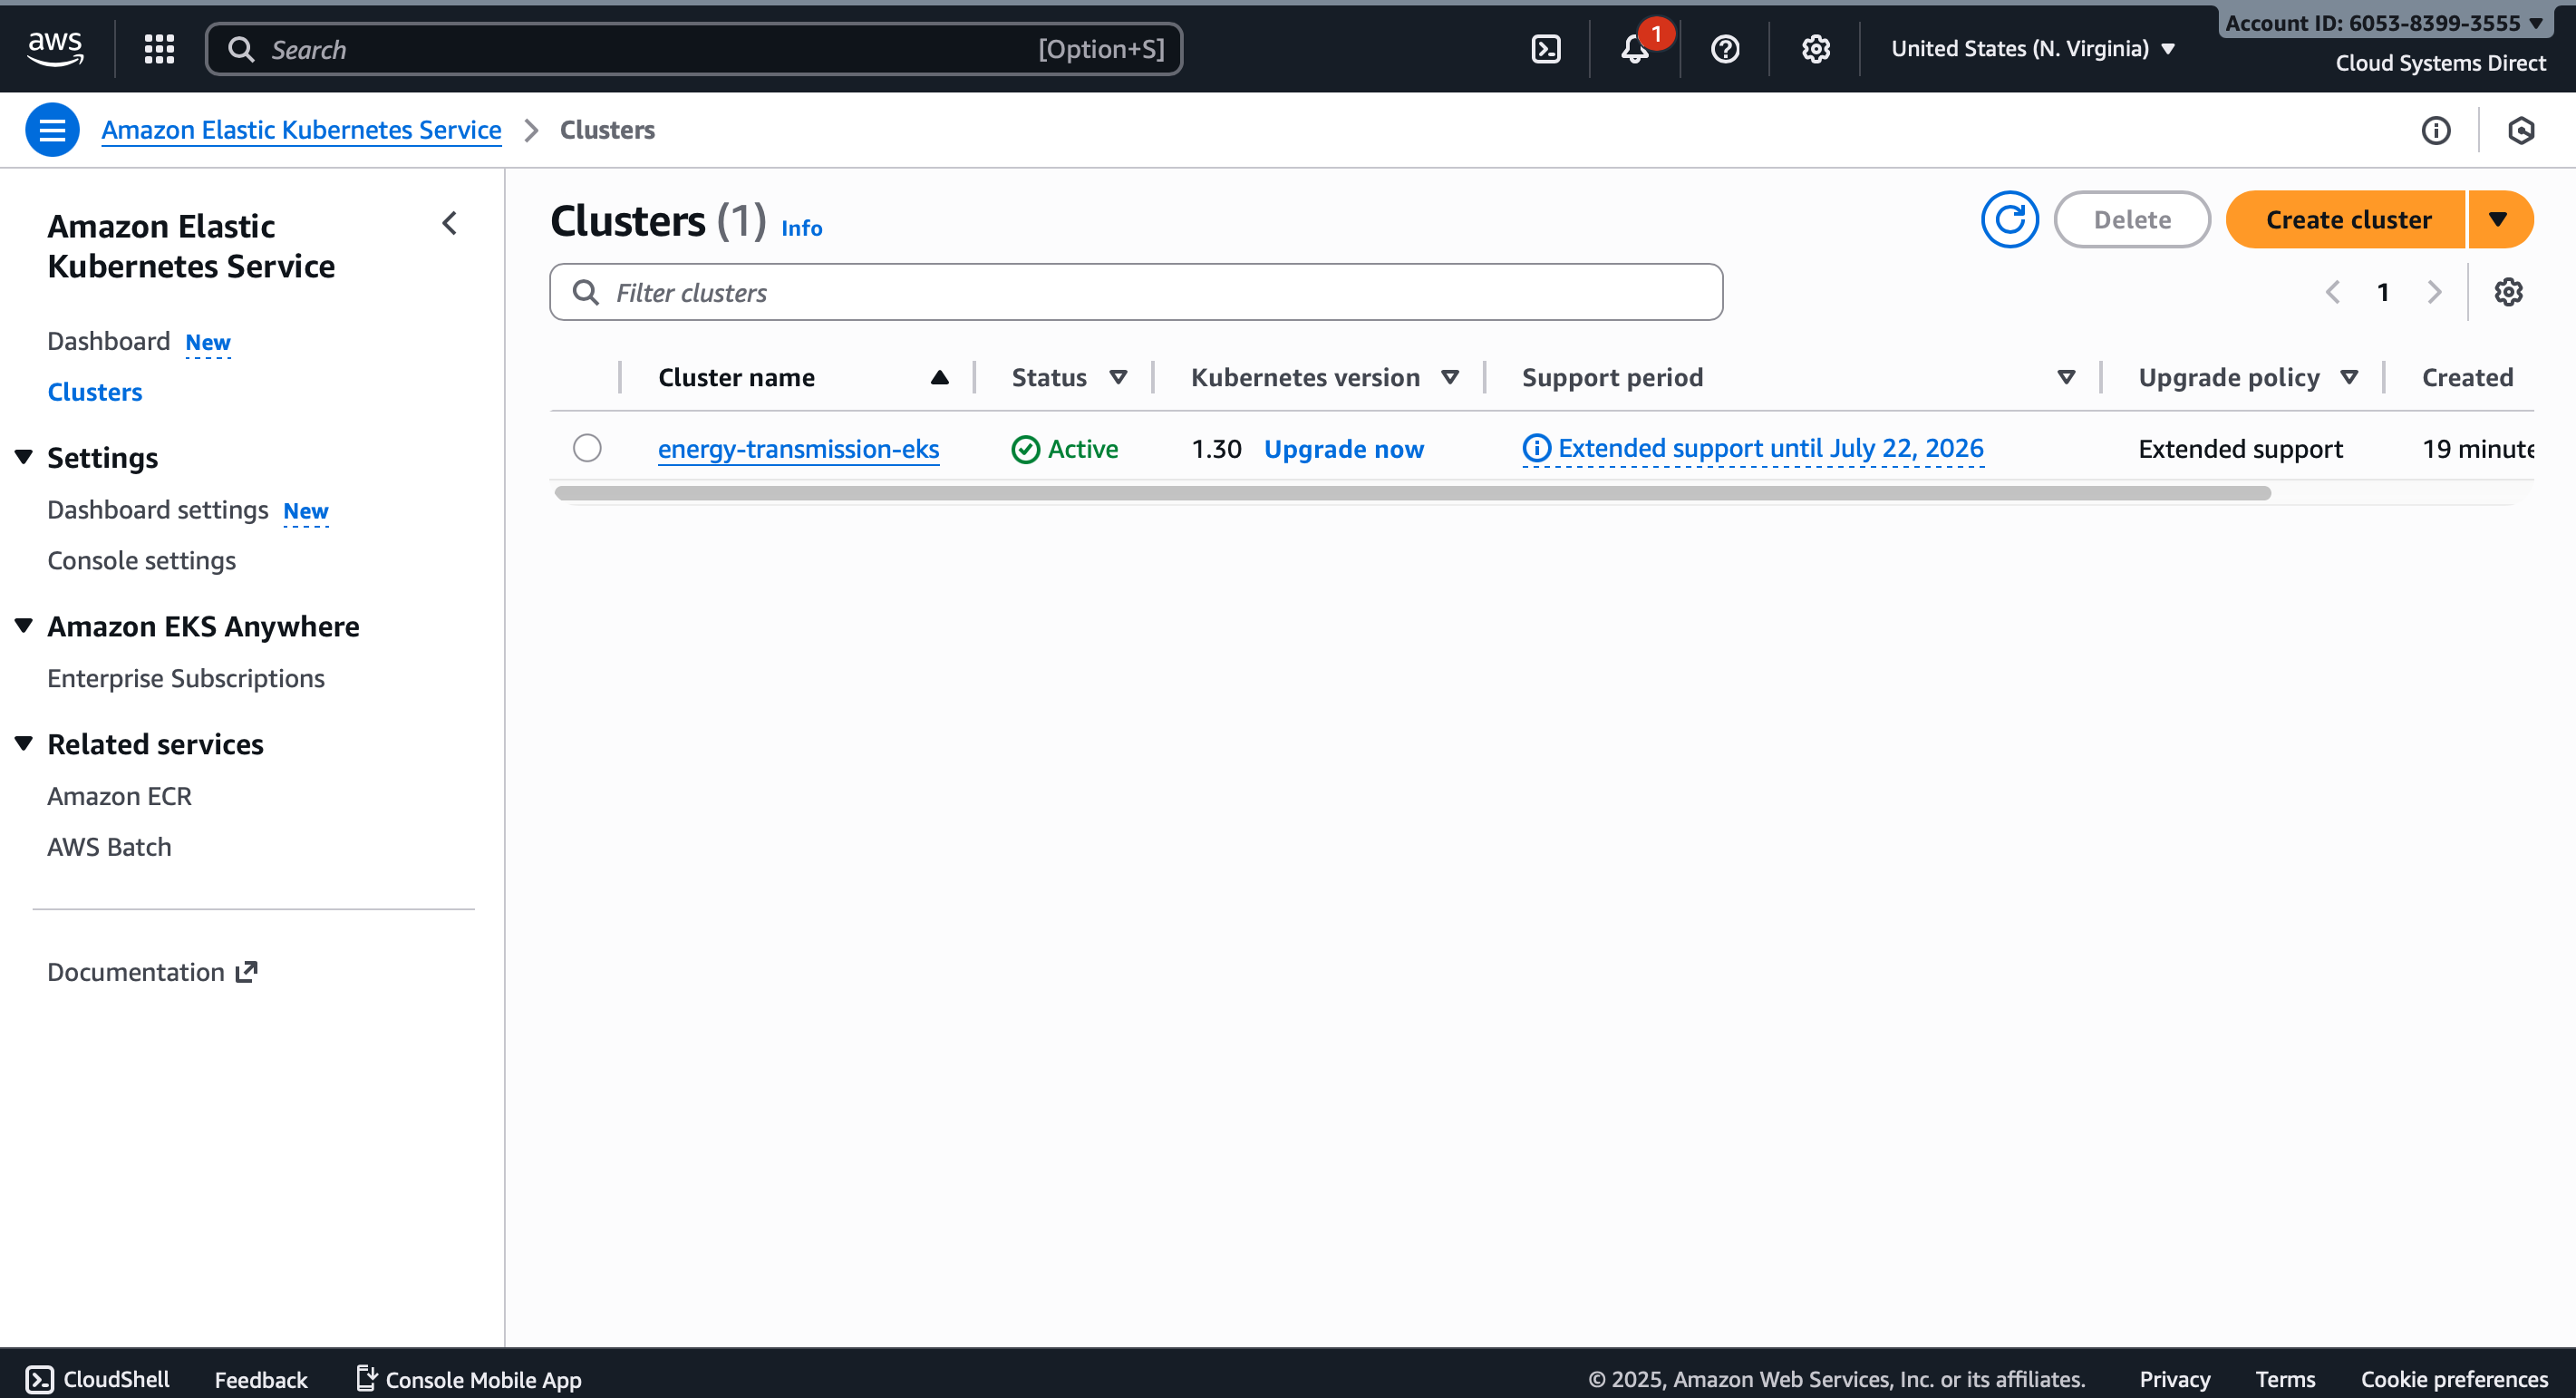
To keep momentum, I pivoted to AWS EKS. EKS gave me the capacity to complete the Jenkins pipeline, deploy the containerized app, install Prometheus and Grafana, and capture full cluster-level dashboards. This created a setup that spans both OpenShift and EKS while following consistent Kubernetes and DevOps patterns.
Across multiple phases I built the .NET app, Docker image, Kubernetes deployments, Jenkins pipeline, Ansible automation, Prometheus/Grafana monitoring, and connected a provisioned Oracle Autonomous AI Database. It is a realistic demonstration of how I approach cloud engineering in the energy sector, with a clear story of adapting when hardware or platform limits show up.
Live Energy Transmission App
This frame loads the Energy Transmission web application running on my OpenShift cluster. It demonstrates how a utility-style app can be hosted on a modern Kubernetes platform.
Key Features
- Energy Transmission web app running on Kubernetes
- Initial deployment on Red Hat OpenShift to mirror enterprise stack
- AWS EKS used as a practical workaround to finish CI CD and observability
- Jenkins driven pipeline with Docker image build and deploy
- Prometheus metrics and Grafana dashboards for cluster and app health
- Oracle Autonomous AI DB provisioned for transmission and grid data
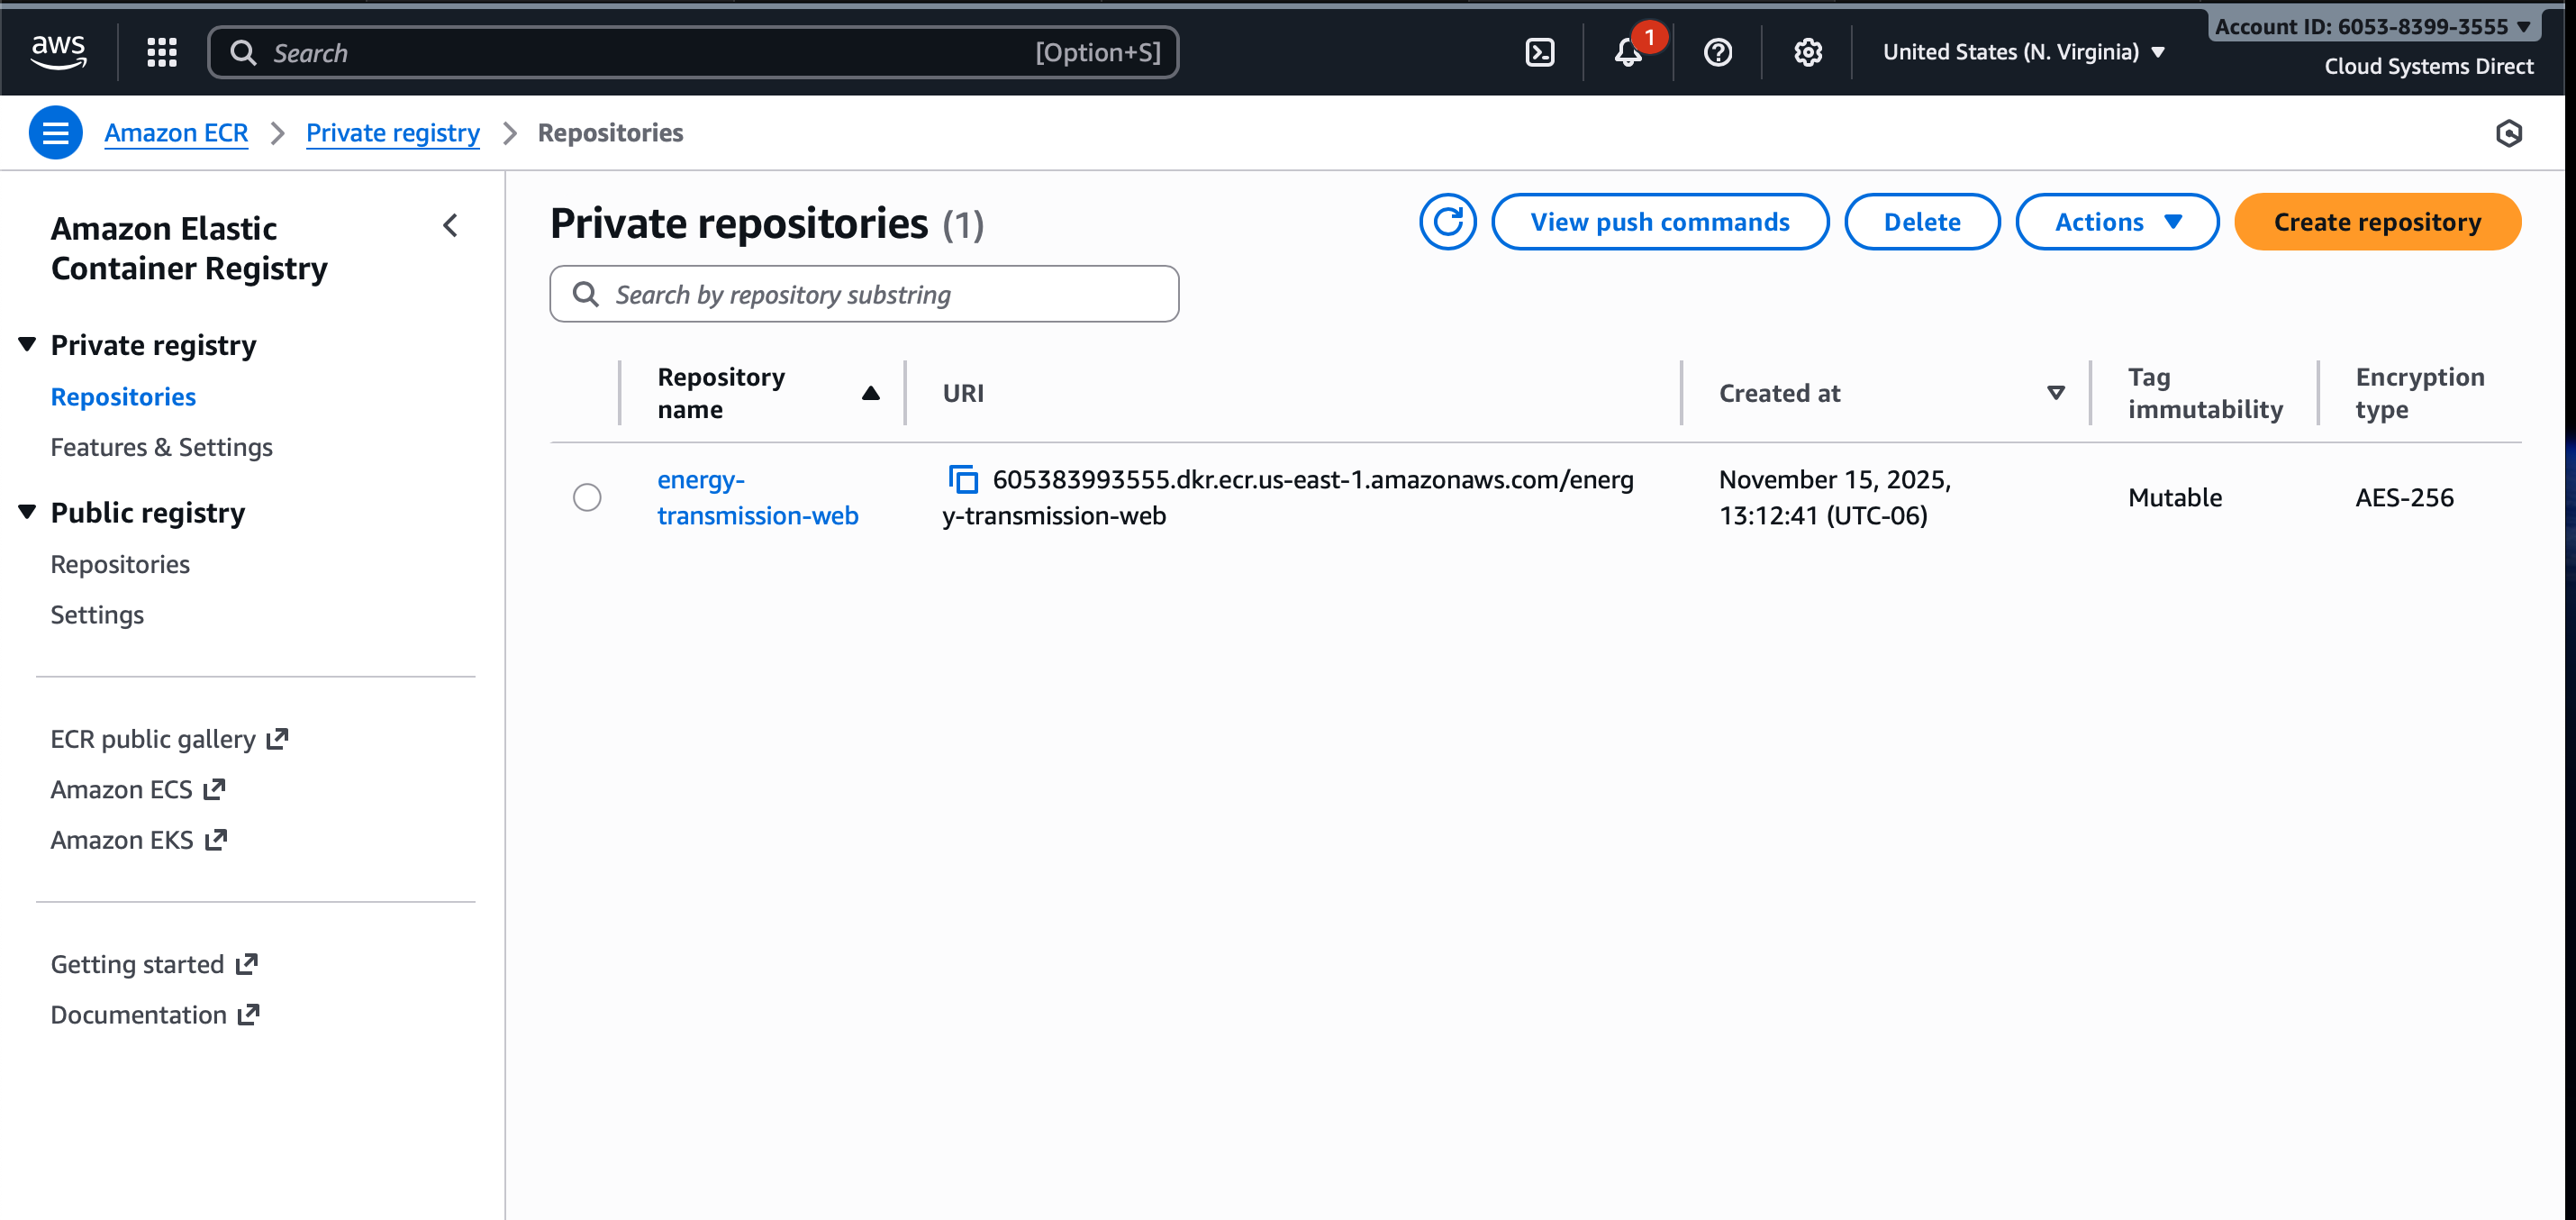
Architecture
The architecture follows a modern utility pattern: developers push to GitHub, a Jenkins pipeline builds and pushes a Docker image, Kubernetes clusters (OpenShift and EKS) run the Energy Transmission app, Prometheus scrapes metrics, Grafana visualizes health and performance, and an Oracle database is in place as the long term data store for line and event history.
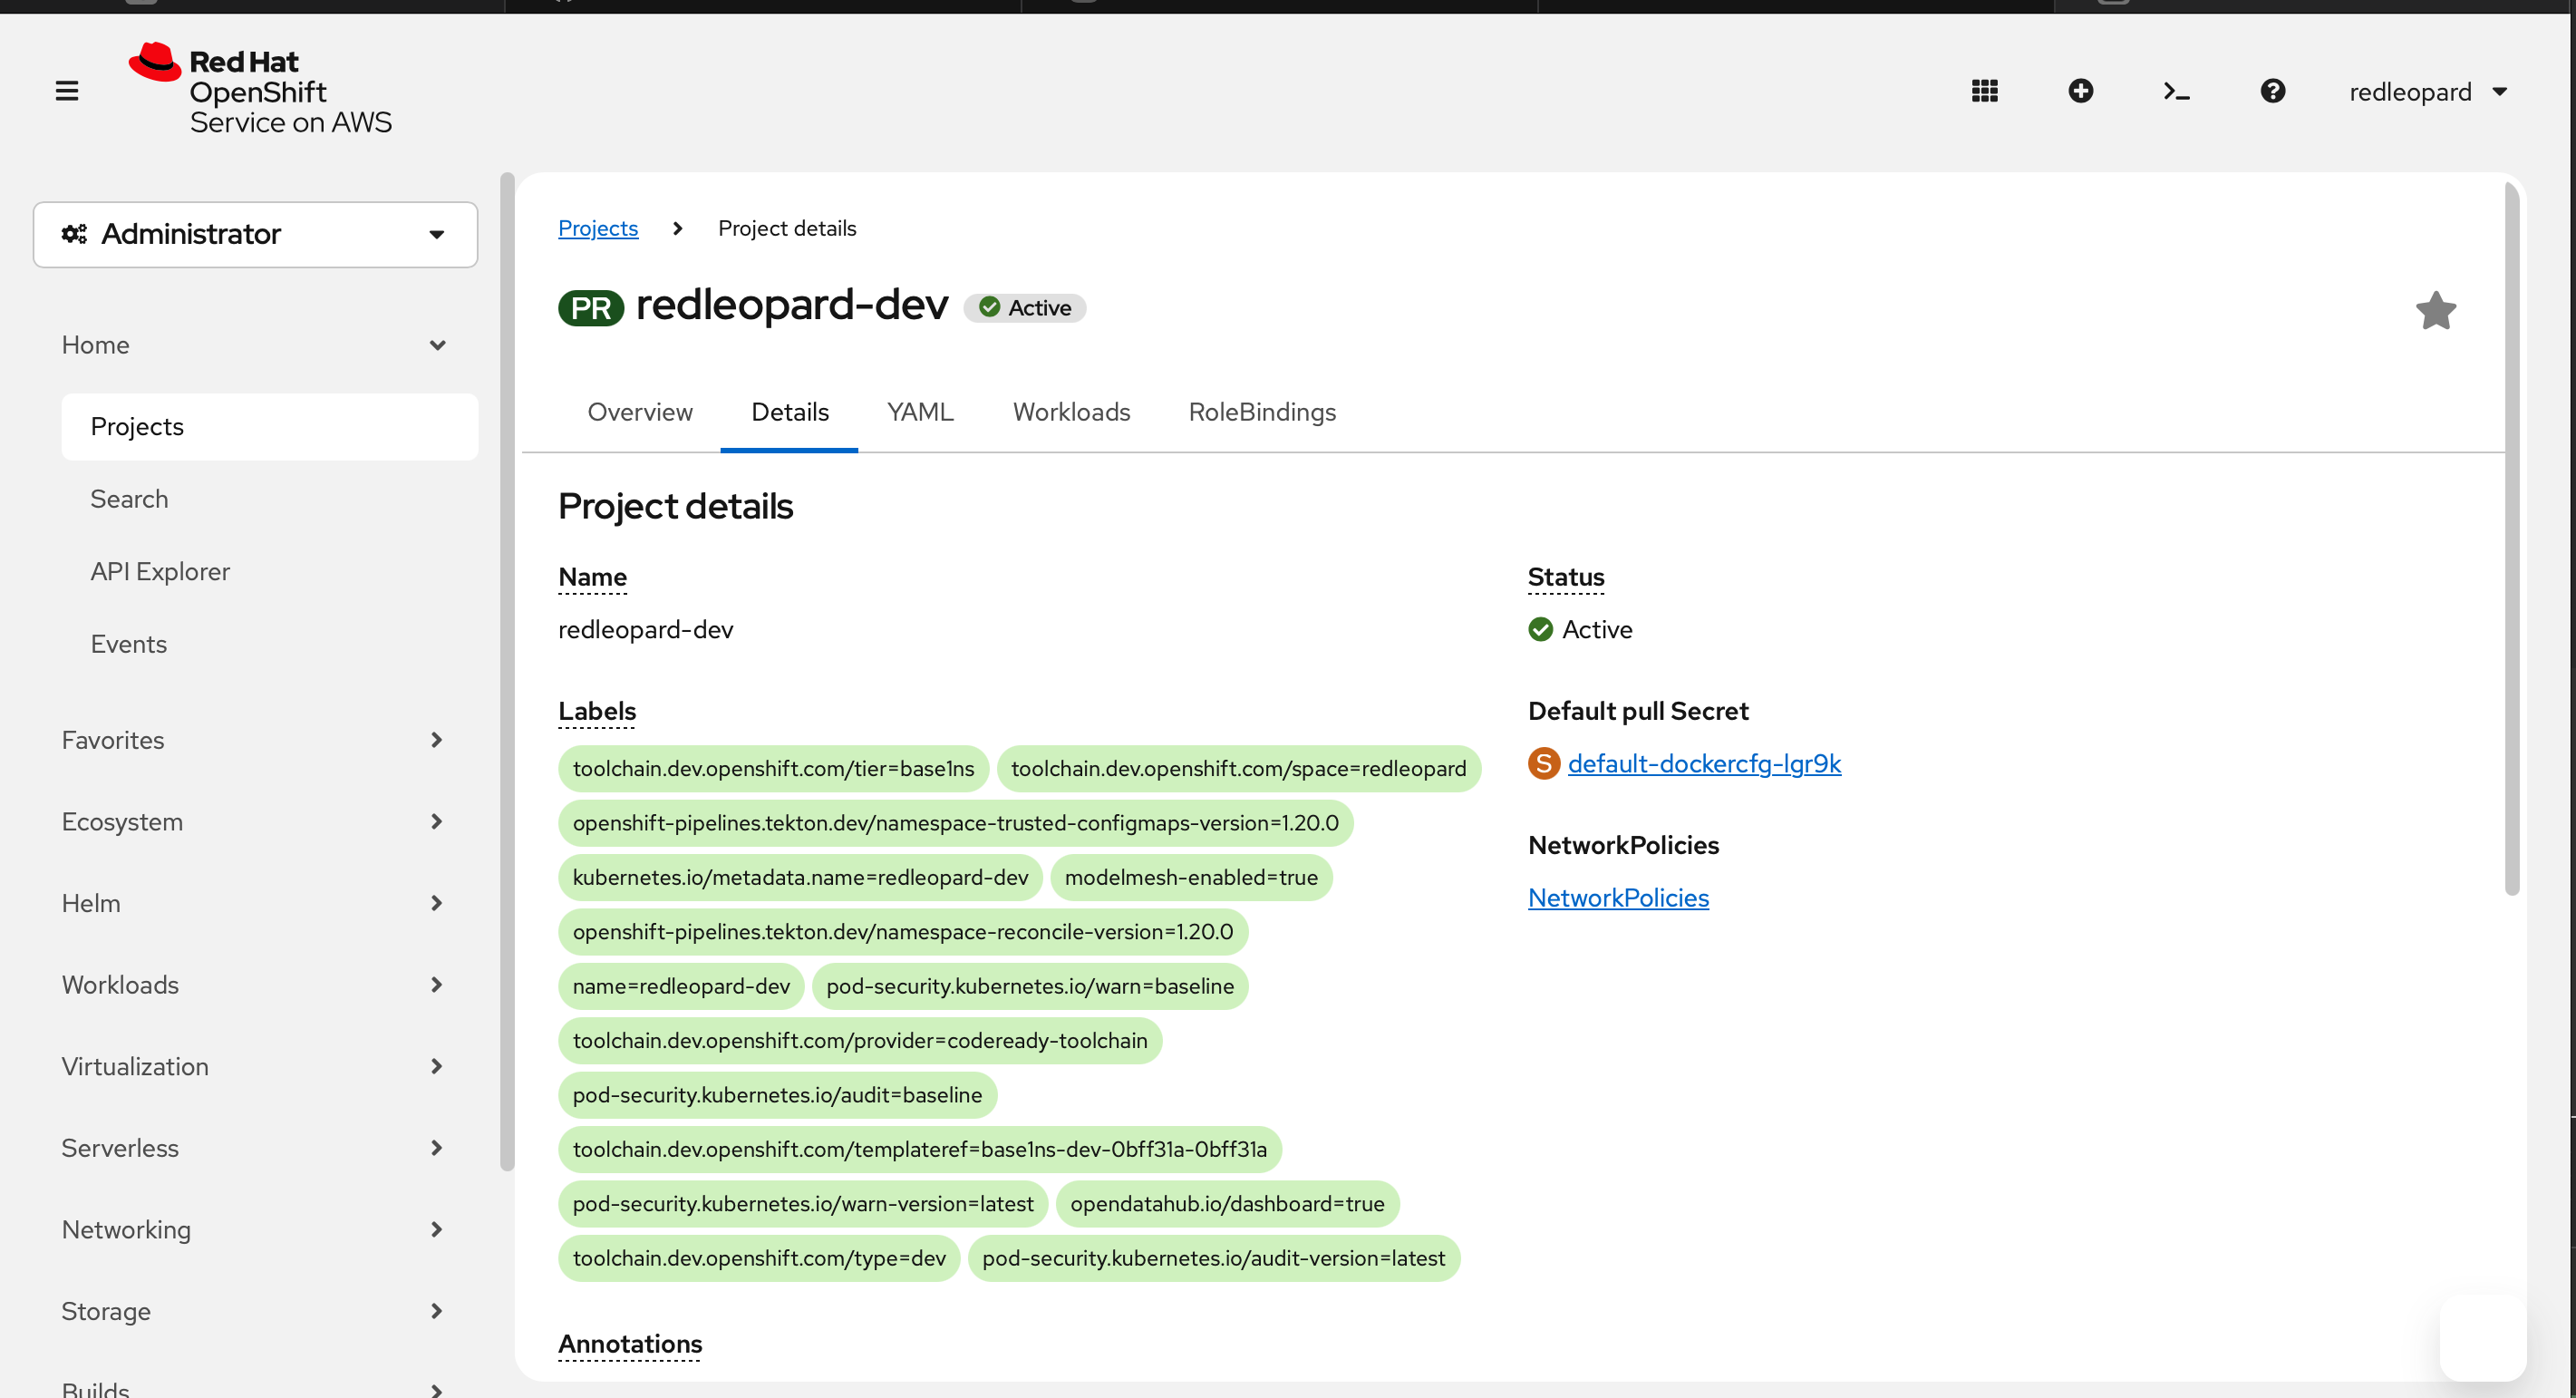
OpenShift And AWS EKS
The project started on Red Hat OpenShift, which matches the platform used by many energy companies. I created a project, deployed the Energy Transmission app, and exposed it with a route inside OpenShift. When local compute limits blocked running additional services, I shifted the remaining work to AWS EKS so I could complete the technical demo without losing the original design.
Live Demo - Cluster To Application Walkthrough
This clip walks through the running environment, from the cluster views down to the application. It shows how the Energy Transmission app would sit inside a Kubernetes platform and how it could support internal dashboards or APIs for line status, outage tracking, and reliability insights.
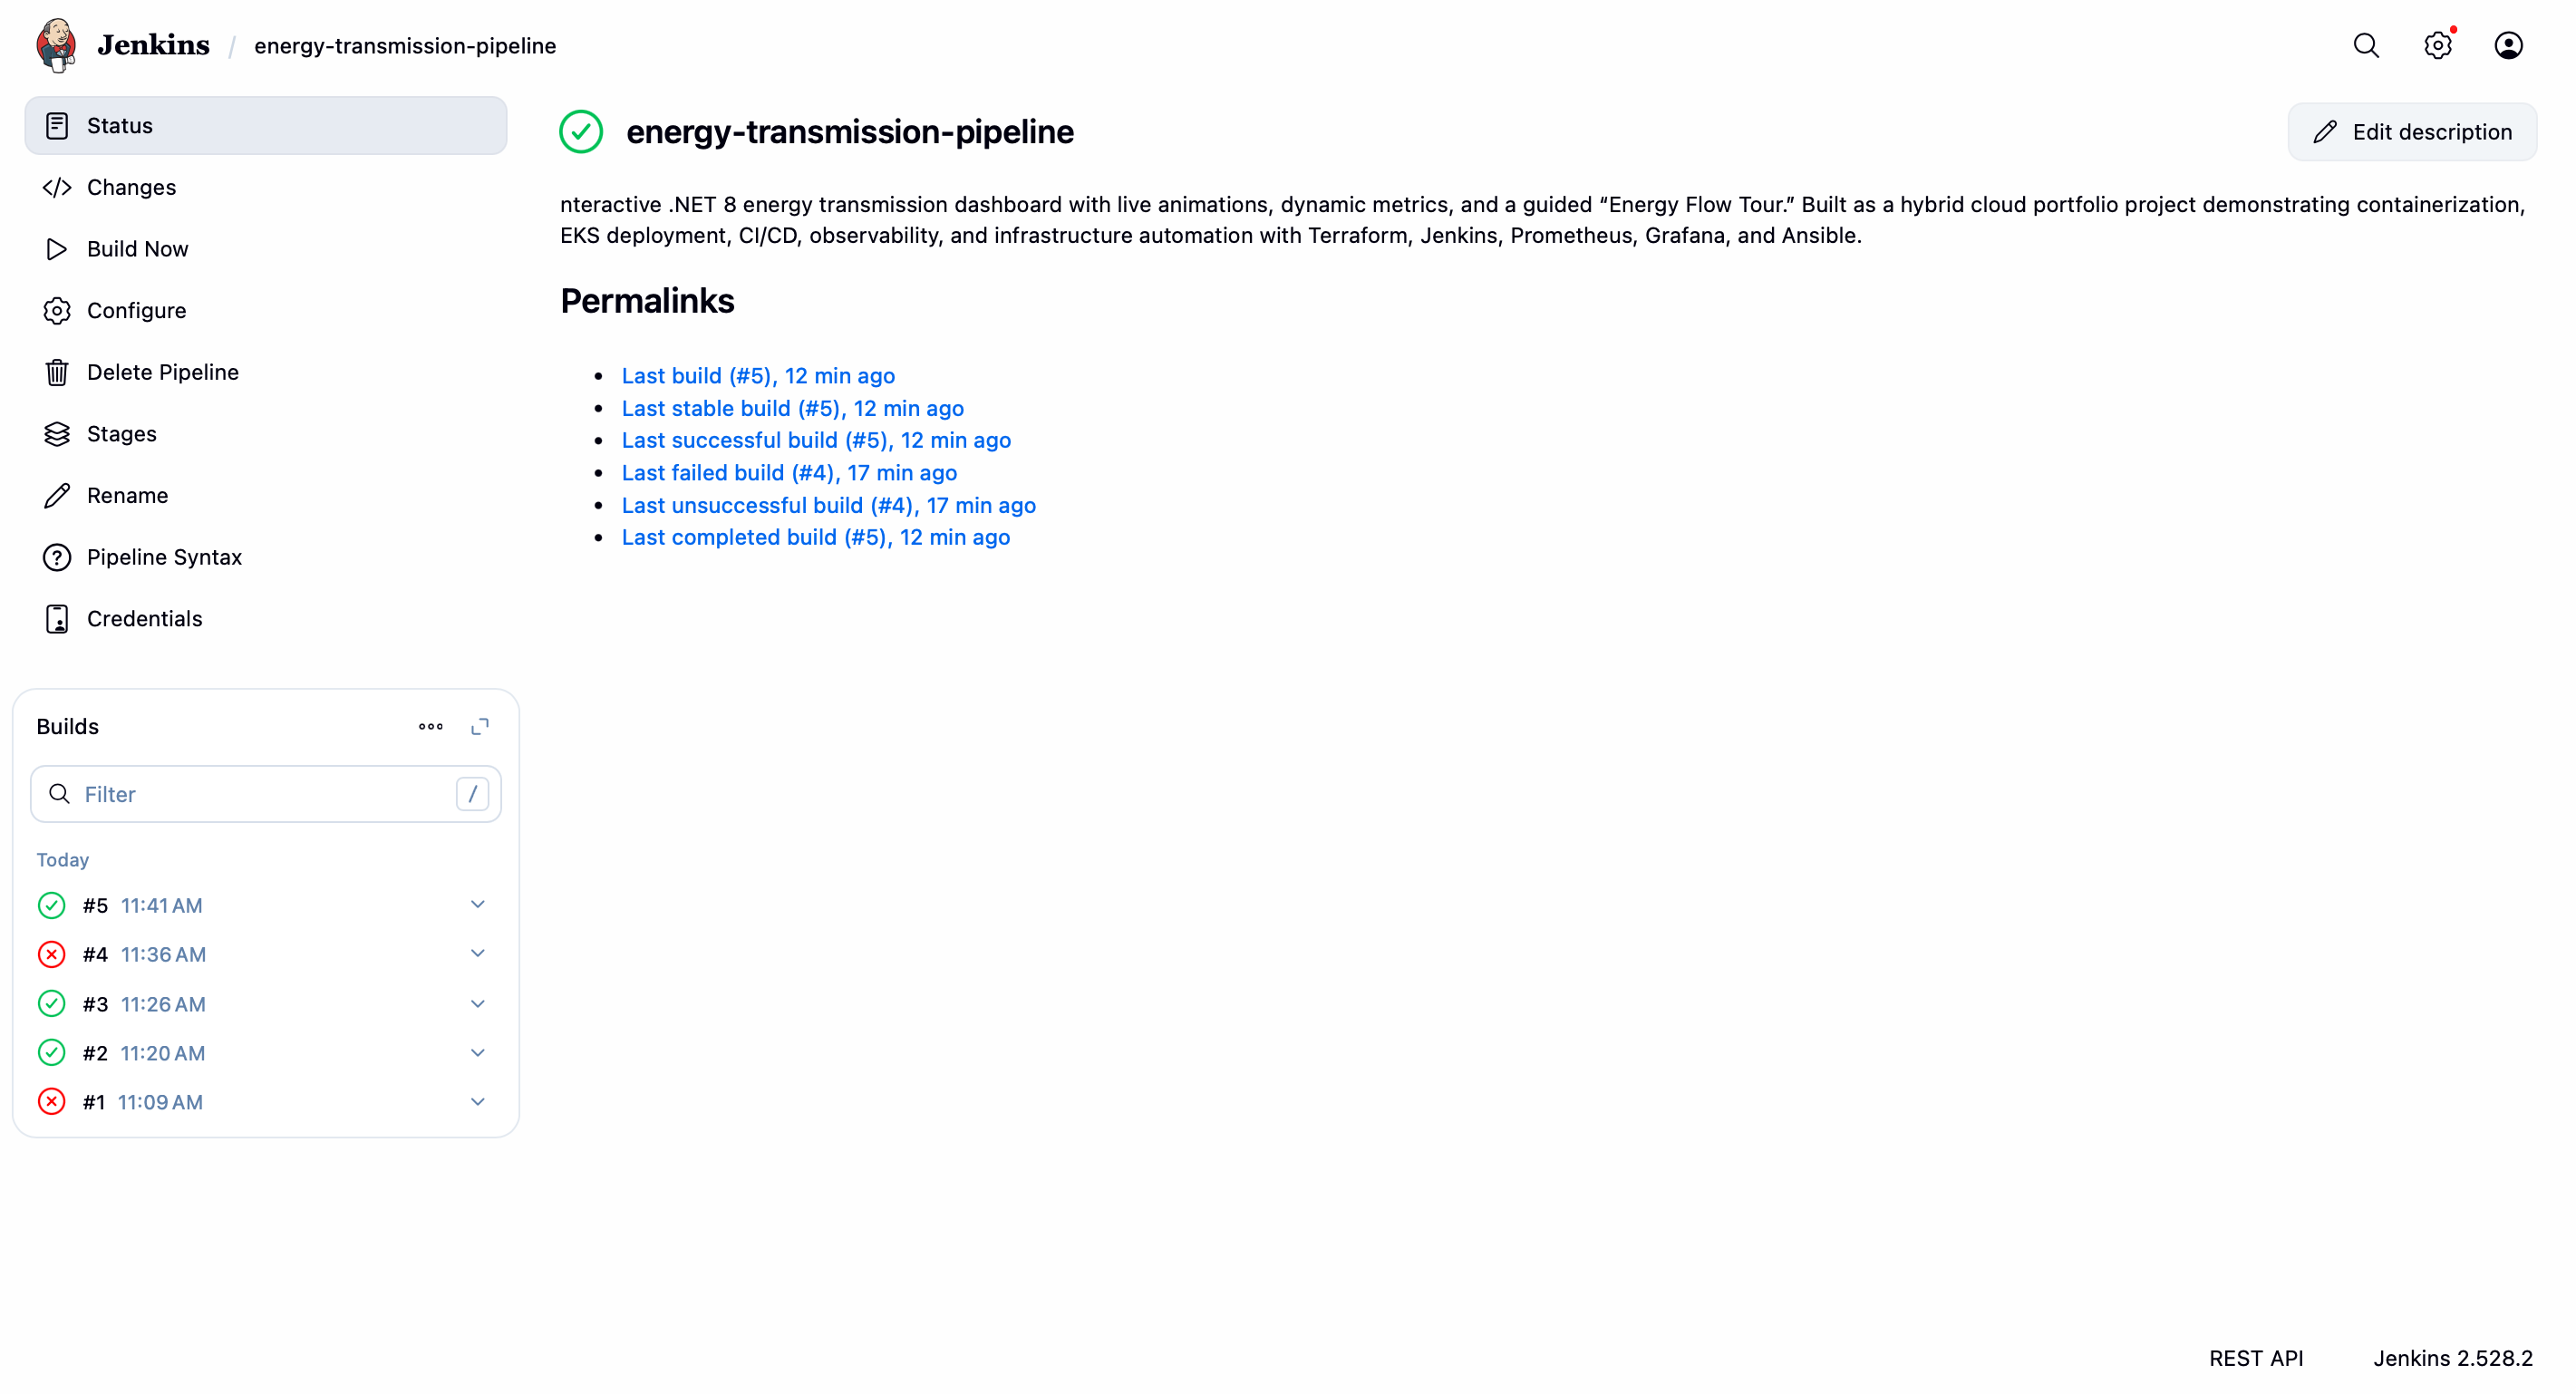
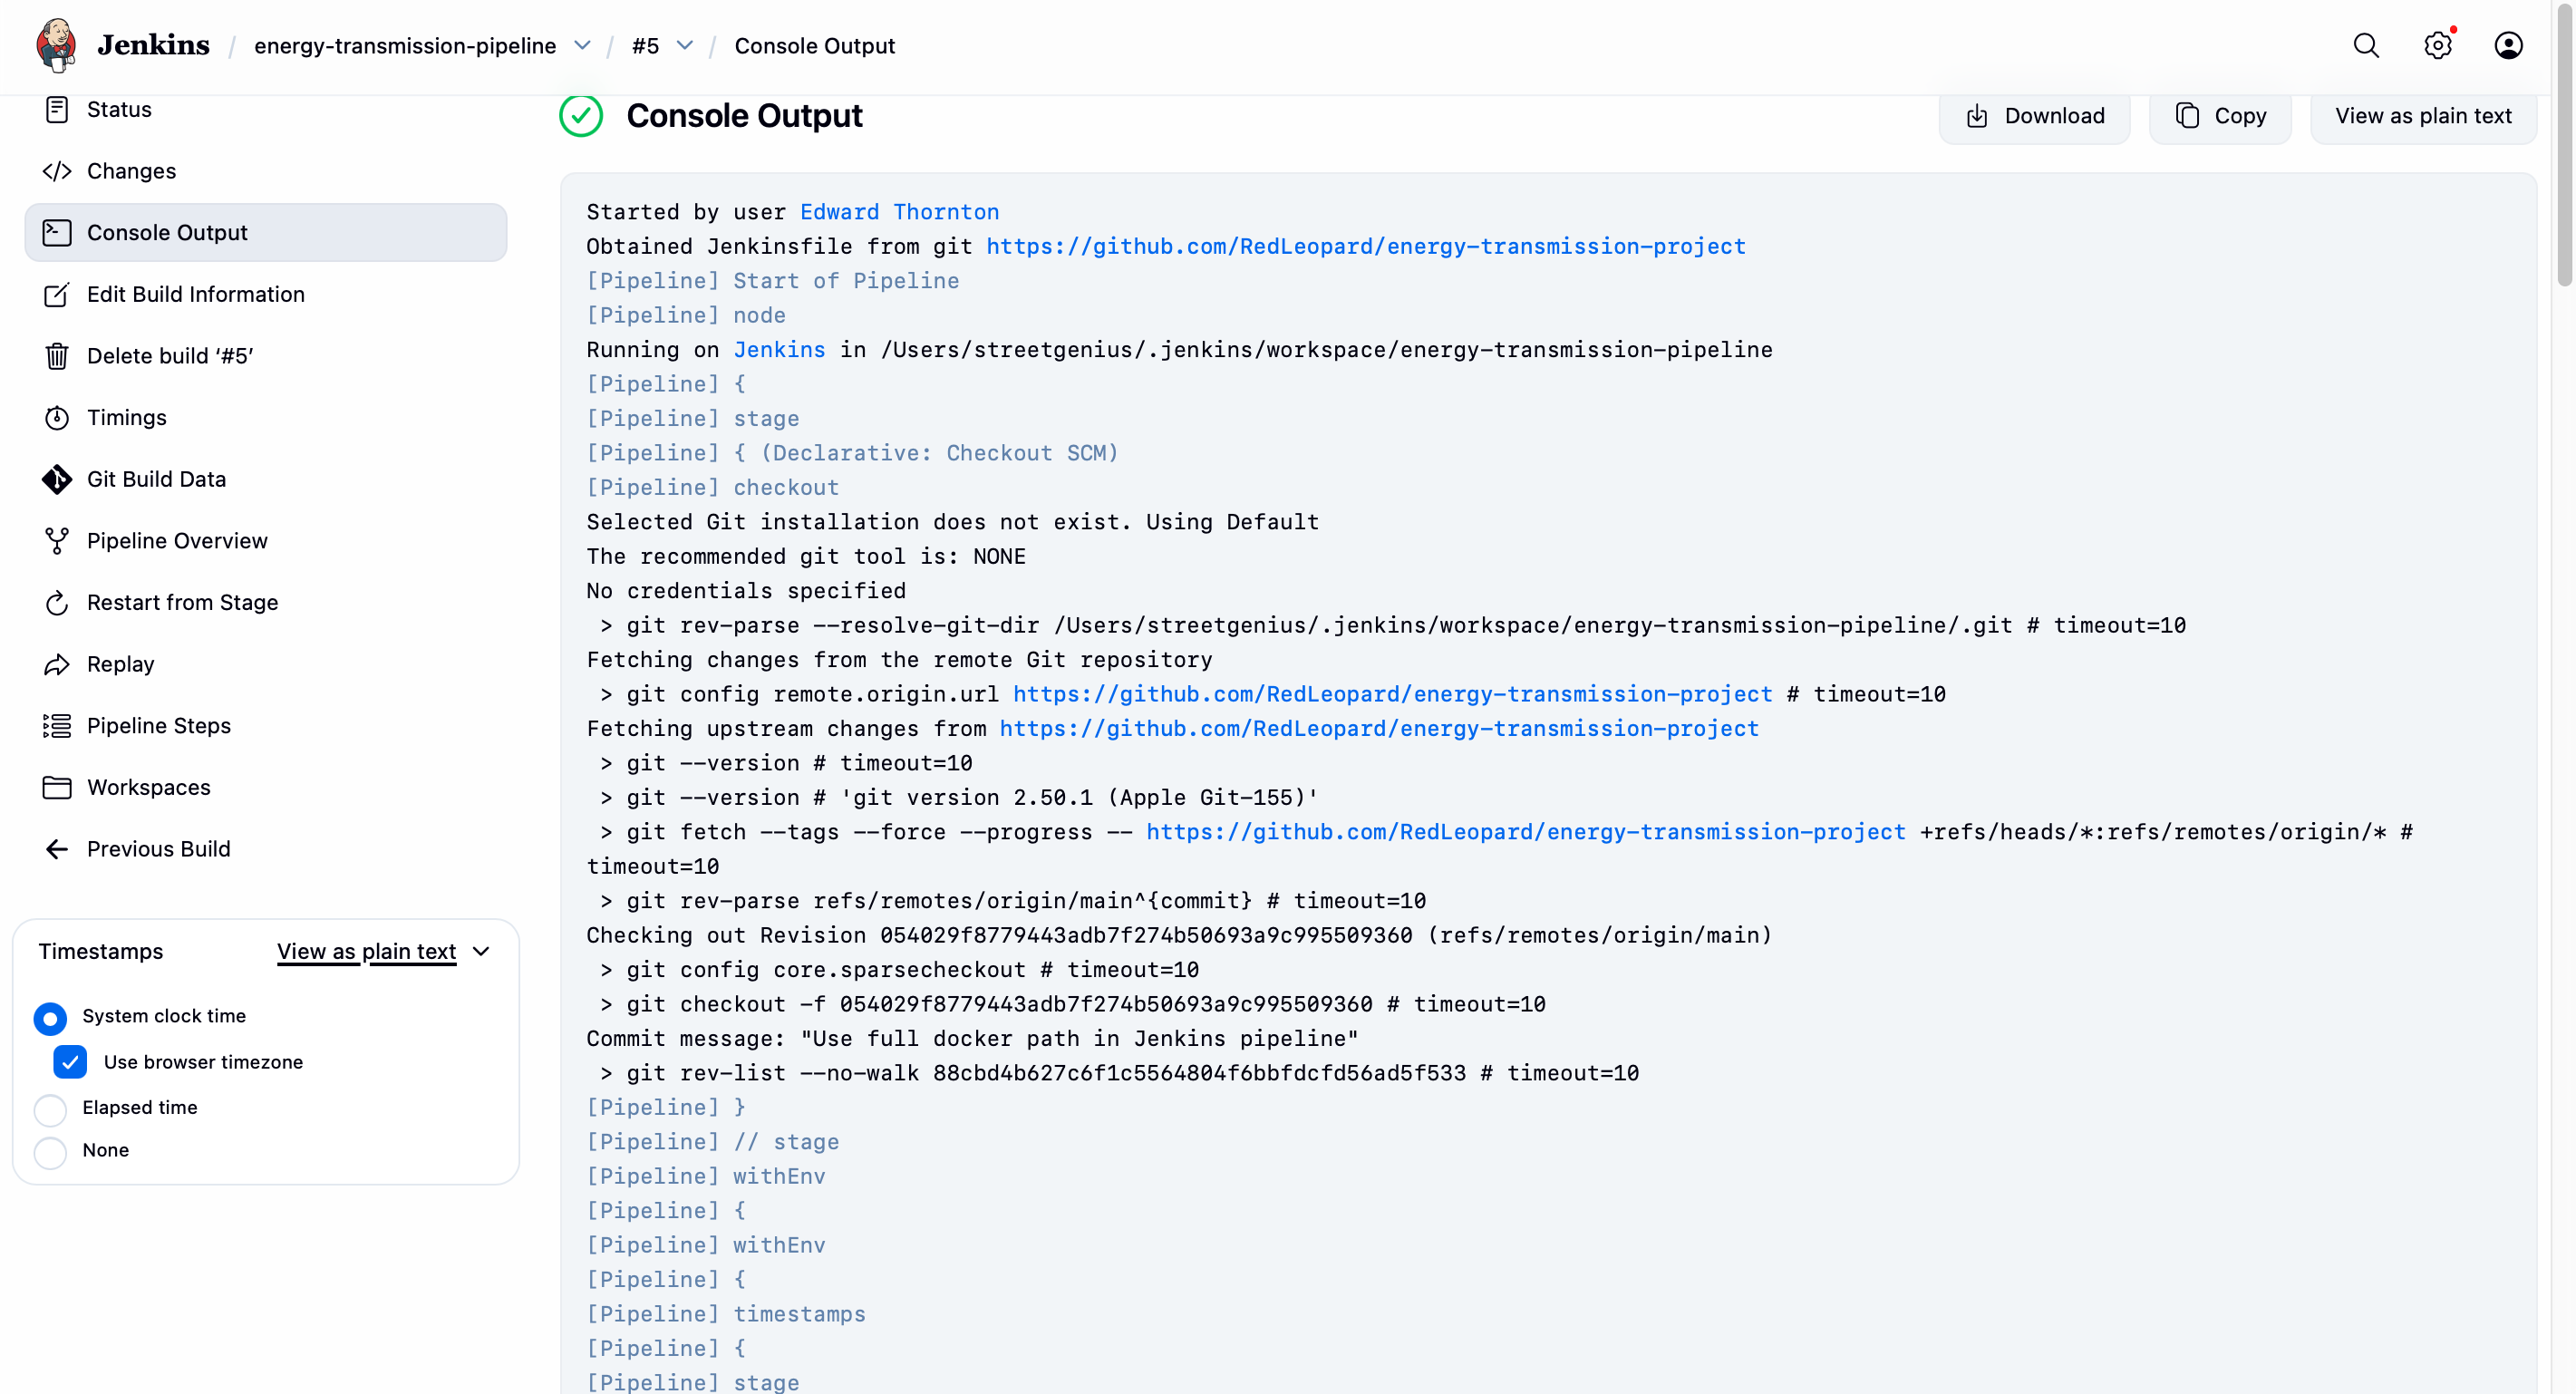
Jenkins CI CD Pipeline
The Jenkins pipeline is the backbone of automation for this project.
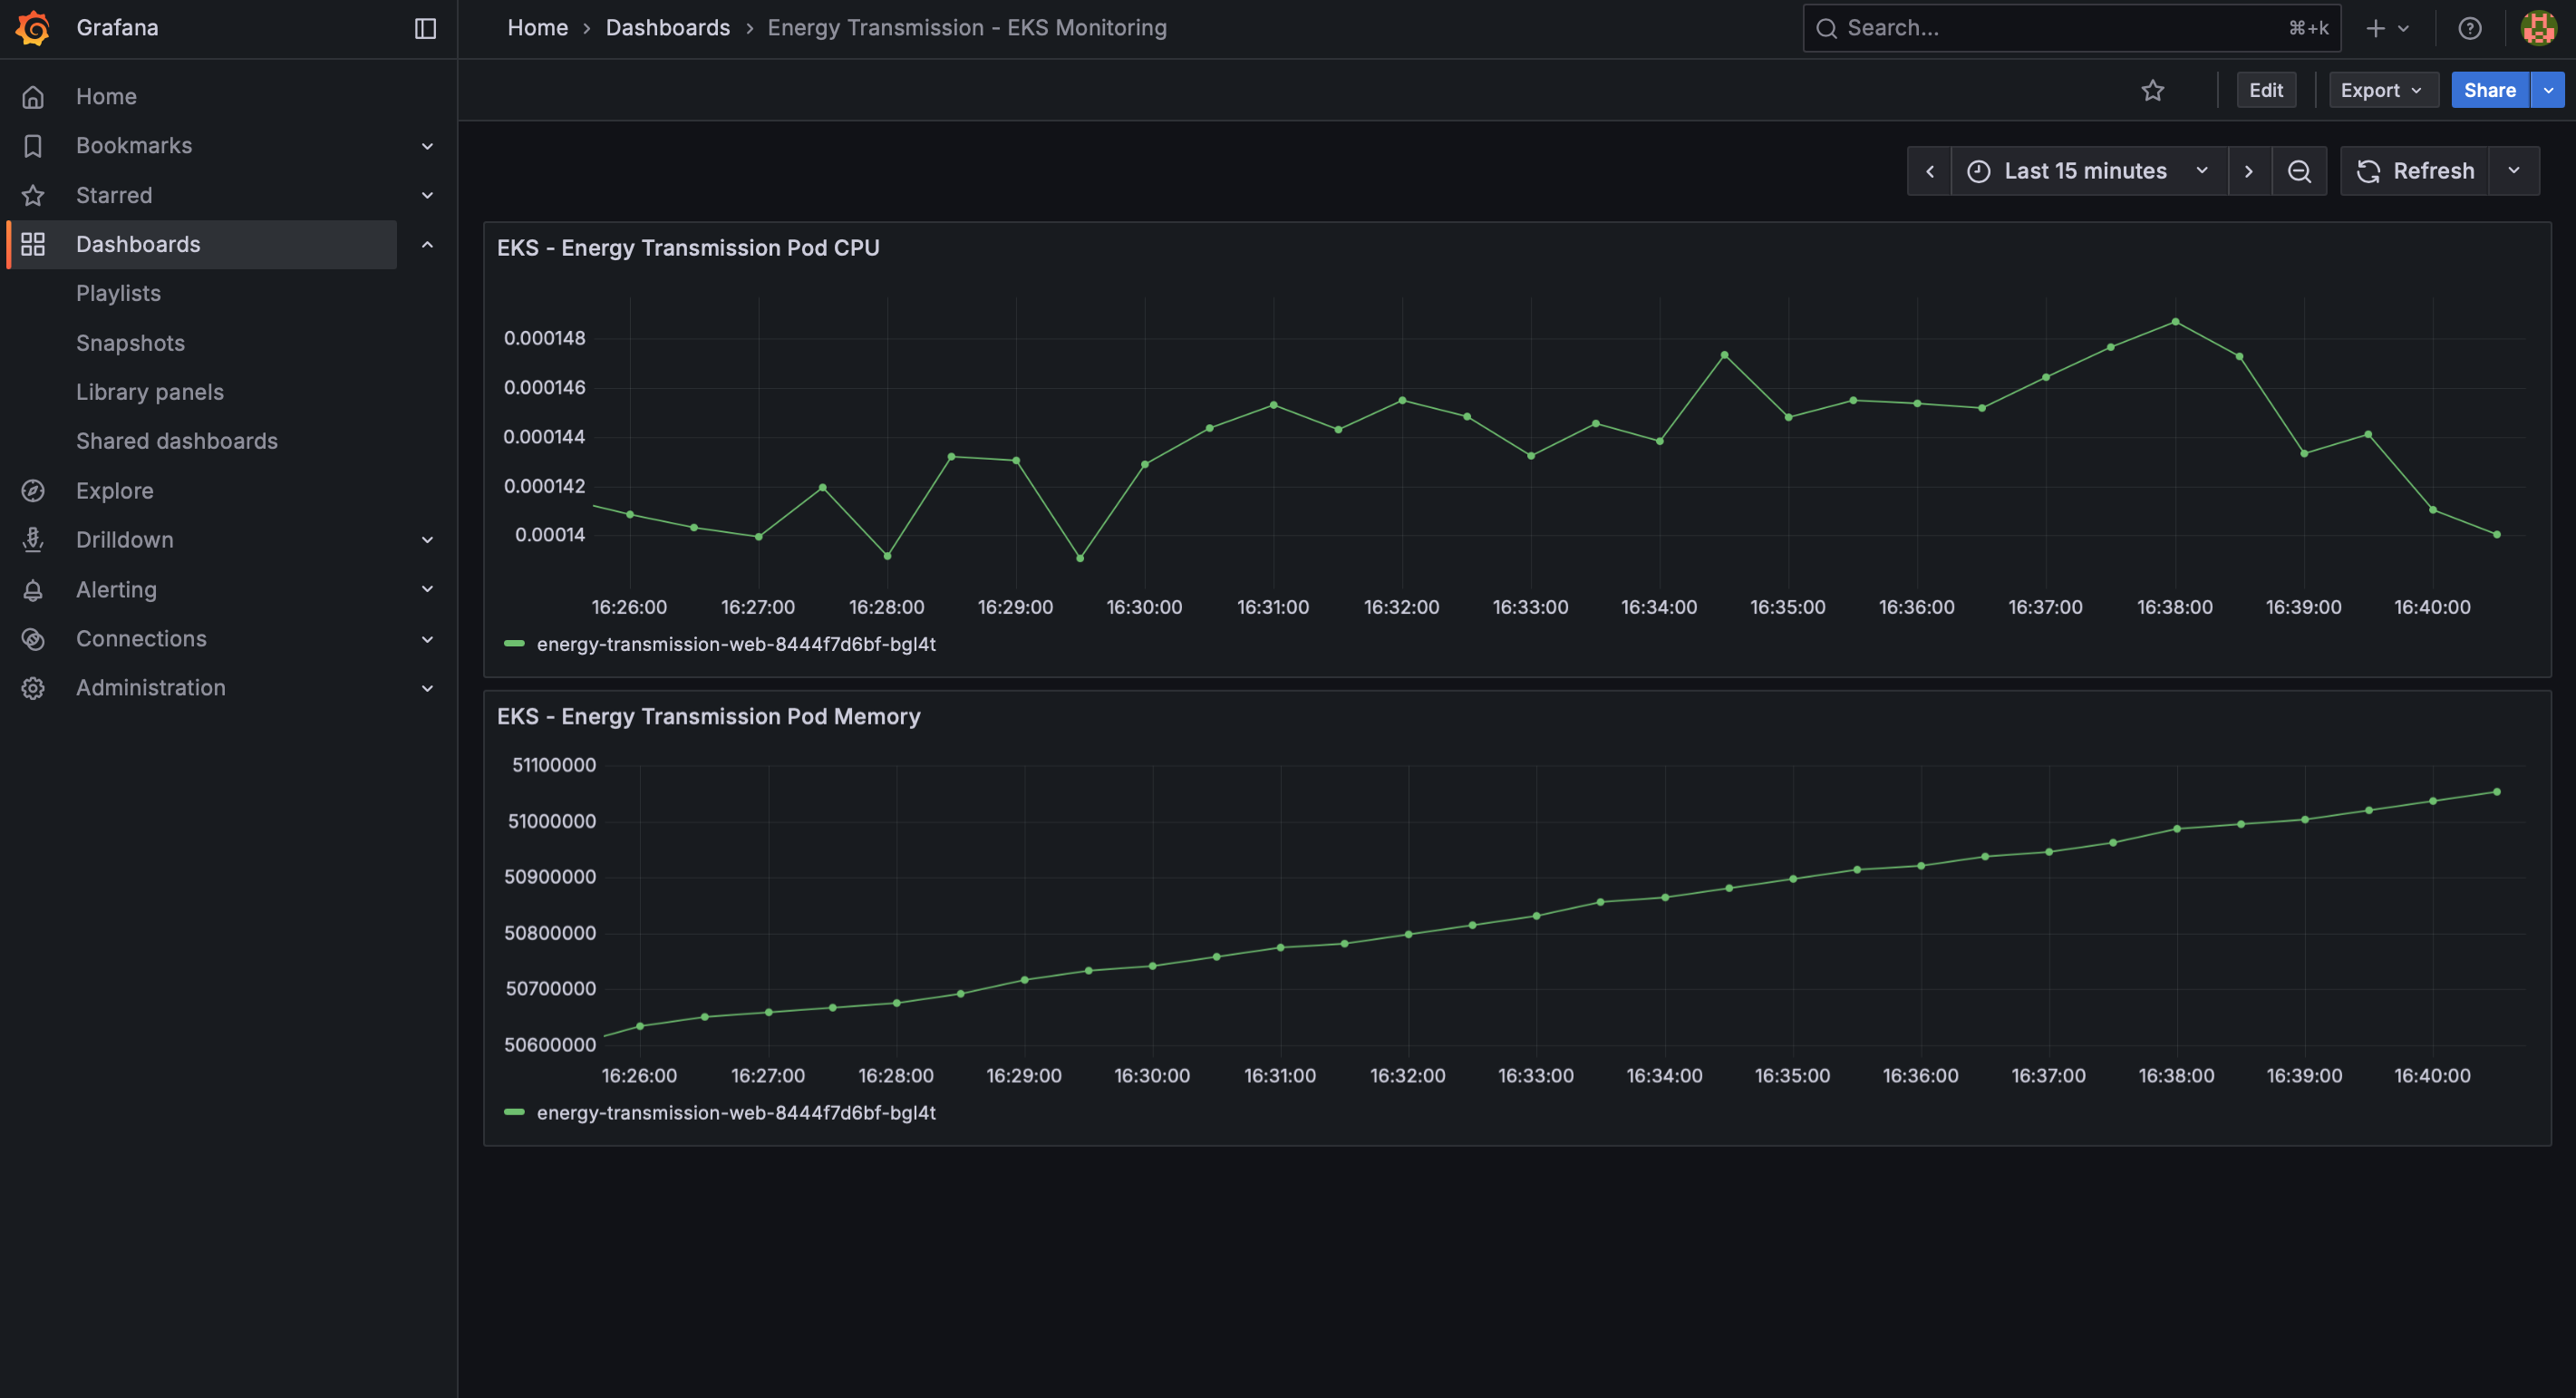
Prometheus And Grafana
Prometheus collects metrics from the Kubernetes environment and from the Energy Transmission app. Grafana turns those metrics into dashboards that feel like a control room view for grid operators, with pod health, node usage, and application level indicators in one place.
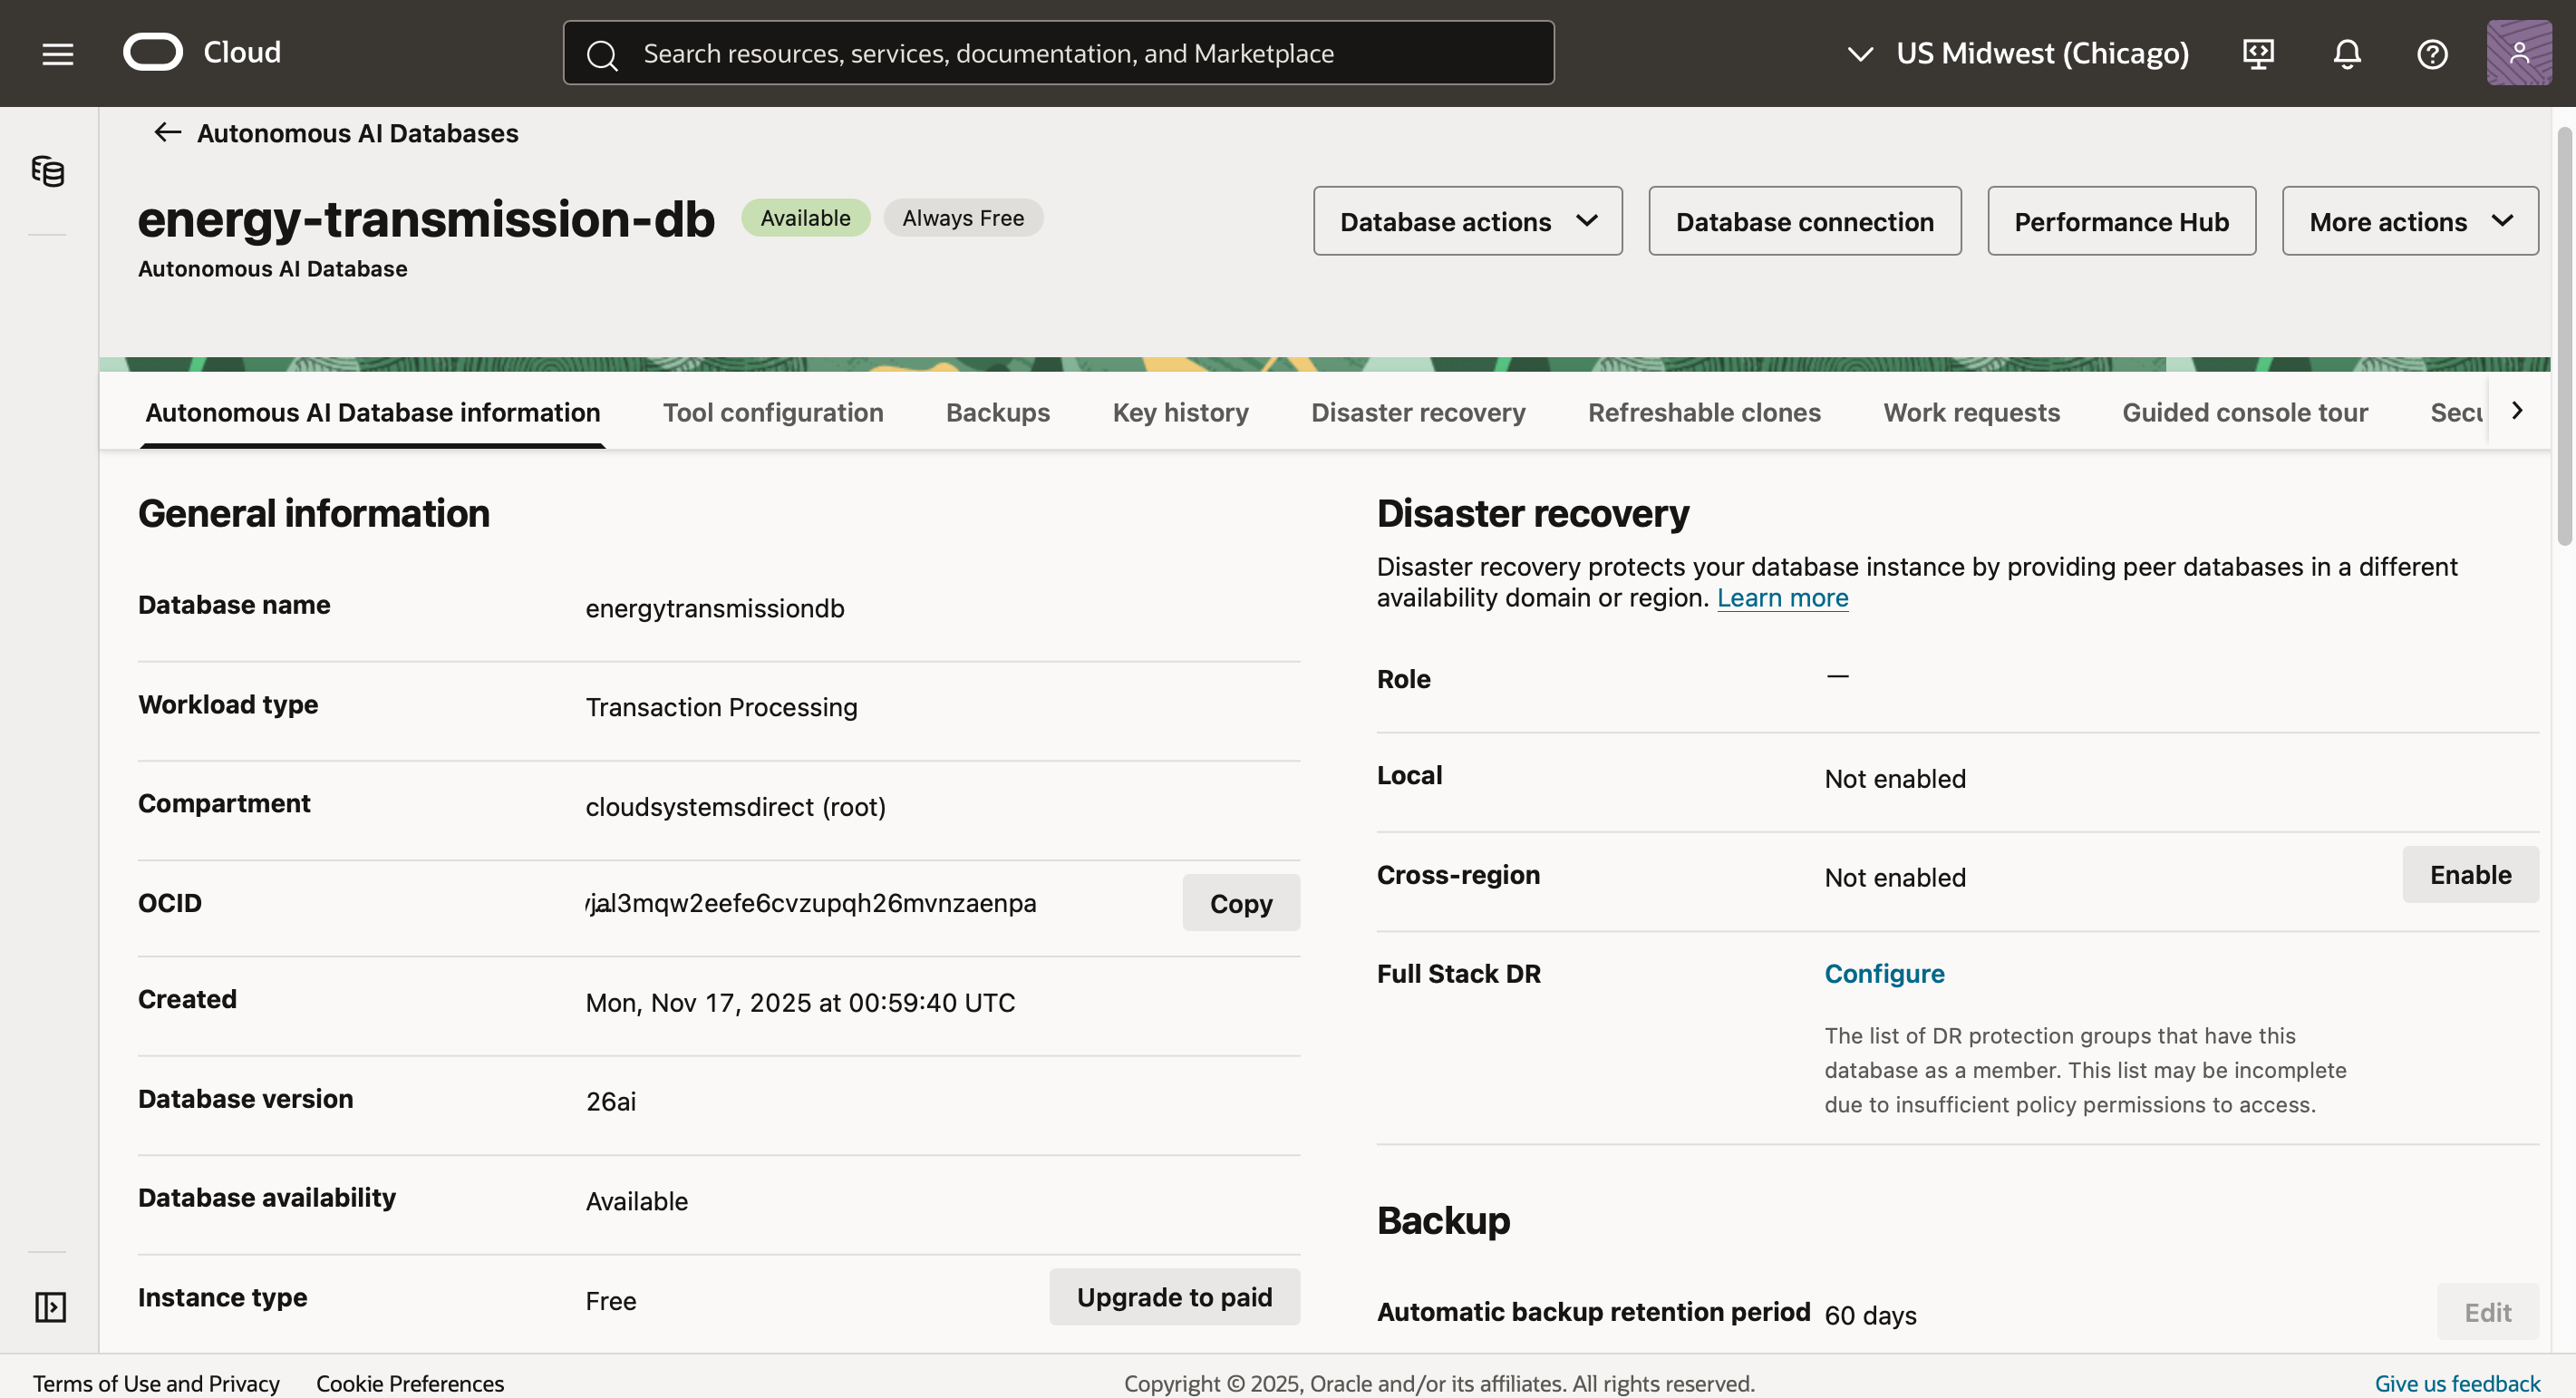
Oracle AI Database
The Oracle database and AI integration work demonstrated how the energy platform can combine structured operational data with intelligent analytics. We configured Oracle ADB and connected it to the application, enabling future predictive insights and automated energy-flow decisions that strengthen the project’s real-world utility and overall modern cloud capability